
Page 187 - Customs Anual Report 2017
P. 187
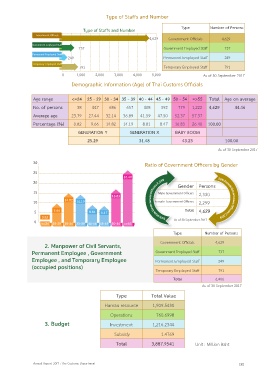
Type of Staffs and Number
Type Number of Persons
Type of Staffs and Number
Government Officials
4,629 Government Officials 4,629
Government Employed Staff
737 Government Employed Staff 737
Permanent Employed Staff
249 Permanent Employed Staff 249
Temporary Employed Staff
791 Temporary Employed Staff 791
0 1,000 2,000 3,000 4,000 5,000 As of 30 September 2017
Demographic Information (Age) of Thai Customs Officials
Age range <=24 25 - 29 30 - 34 35 - 39 40 - 44 45 - 49 50 - 54 =>55 Total Age on average
No. of persons 38 447 686 657 408 392 779 1,222 4,629 44.46
Average age 23.79 27.44 32.14 36.89 41.59 47.50 52.37 57.37
Percentage (%) 0.82 9.66 14.82 14.19 8.81 8.47 16.83 26.40 100.00
GENERATION Y GENERATION X BABY BOOM
25.29 31.48 43.23 100.00
As of 30 September 2017
30 Ratio of Government Officers by Gender
25
26.40
20 Gender
Gender PersonsPersons
15 Male Government Officers 2,330
Male Government Officers
2,330
16.83 50% Male Government Officers 2,330
Female Government Officers
2,299
10 14.82 14.19 Female Government Officers 2,299 50% Female Government Officers 2,299
4,629
5 9.66 8.81 8.47 Total 4,629
0.82
0 <=24 25-29 30-34 35-39 40-44 45-49 50-54 =>55 As of 30 September 2017
Type Number of Persons
Government Officials 4,629
2. Manpower of Civil Servants,
Permanent Employee , Government Government Employed Staff 737
Employee , and Temporary Employee Permanent Employed Staff 249
(occupied positions)
Temporary Employed Staff 791
Total 6,406
As of 30 September 2017
Type Total Value
Human resource 1,909.5430
Operations 760.6998
3. Budget Investment 1,216.2344
Subsidy 1.4769
Total 3,887.9541 Unit : Million Baht
Annual Report 2017 The Customs Department 181